
Hockey props look random from the couch. A puck hits a post, a goalie stands on his head, a fourth-liner scores twice. Underneath that noise sit a few numbers that are steady from night to night: how many minutes a player gets, how often he shoots when he is on the ice, and how many shots the other team gives up. Get those right and most NHL props become a question you can price. This guide is part of our Sport Guides series and covers the four markets people bet most: shots on goal, anytime goal scorer, points and goalie saves.
Shots on goal start with ice time
A shot on goal has to reach the goalie or go in. Blocked shots and misses do not count, which is why shot attempts and shots on goal are different numbers on a box score. The cleanest way to project shots is a rate times minutes: a skater's shots on goal per 60 minutes, multiplied by the ice time you expect tonight.
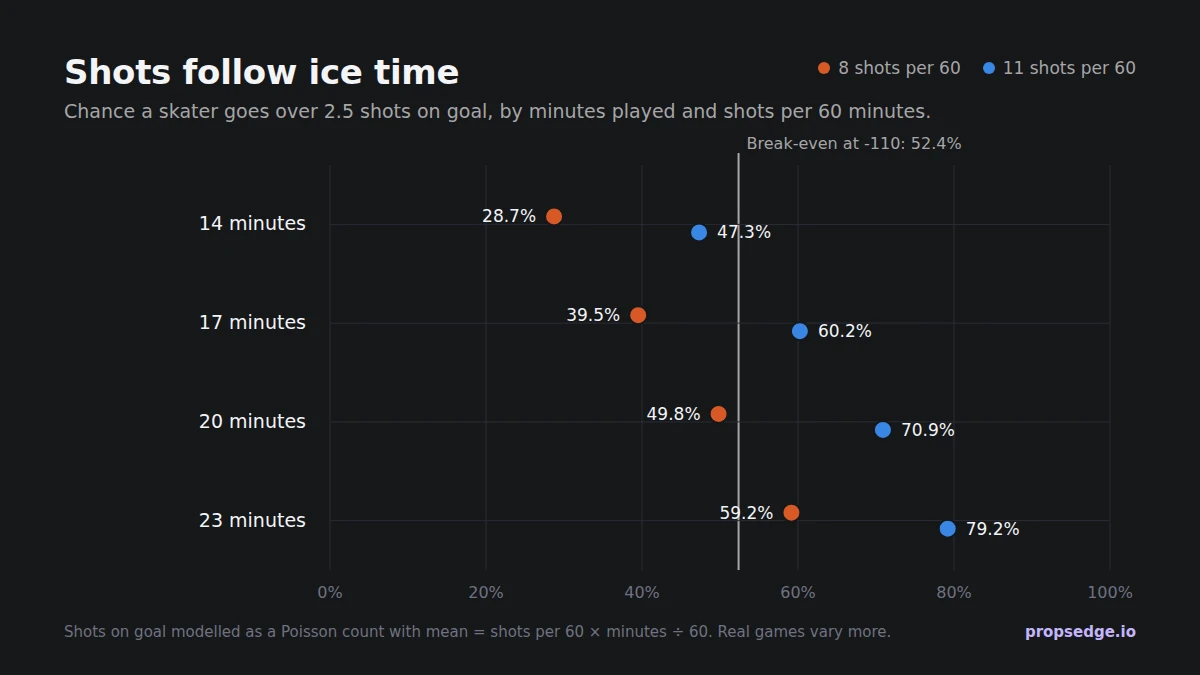
The chart treats shots as a Poisson count, a reasonable model for a number that is usually between zero and six. A forward who shoots 11 times per 60 and plays 20 minutes averages about 3.7 shots, and clears 2.5 about 70.9% of the time. Cut his night to 14 minutes and the same shooter drops to 47.3%, below what a -110 price needs. The Poisson calculator does the same math from any average.
So the first thing to check is not the streak, it is the minutes:
- Power-play role. The top unit plays most of the power-play time and takes most of its shots. A player who moves onto it gets more minutes and better ones.
- Line changes. A forward bumped into the top six can gain four or five minutes overnight. Recent ice time often shows the promotion before the price does.
- Defensemen. Top-pair defensemen play the most minutes on the ice and shoot from the point. Their shot lines are often lower than their volume suggests.
- Game script. A team that falls behind shoots more. A big favorite sitting on a lead can shoot less in the third period.
Half a shot is a big move
Shot lines sit at 1.5, 2.5, 3.5 or 4.5, and the gap between them is huge. For a skater who averages 3.0 shots, the model gives:
- Over 1.5: 80.1%
- Over 2.5: 57.7%
- Over 3.5: 35.3%
That is why the books move the price, not the line, as the money comes in, and why the same 2.5 can be +130 at one sportsbook and -110 at another. An alternate line one rung lower at a shorter price can also be the better bet; the prop ladder shows where each player's production actually sits.
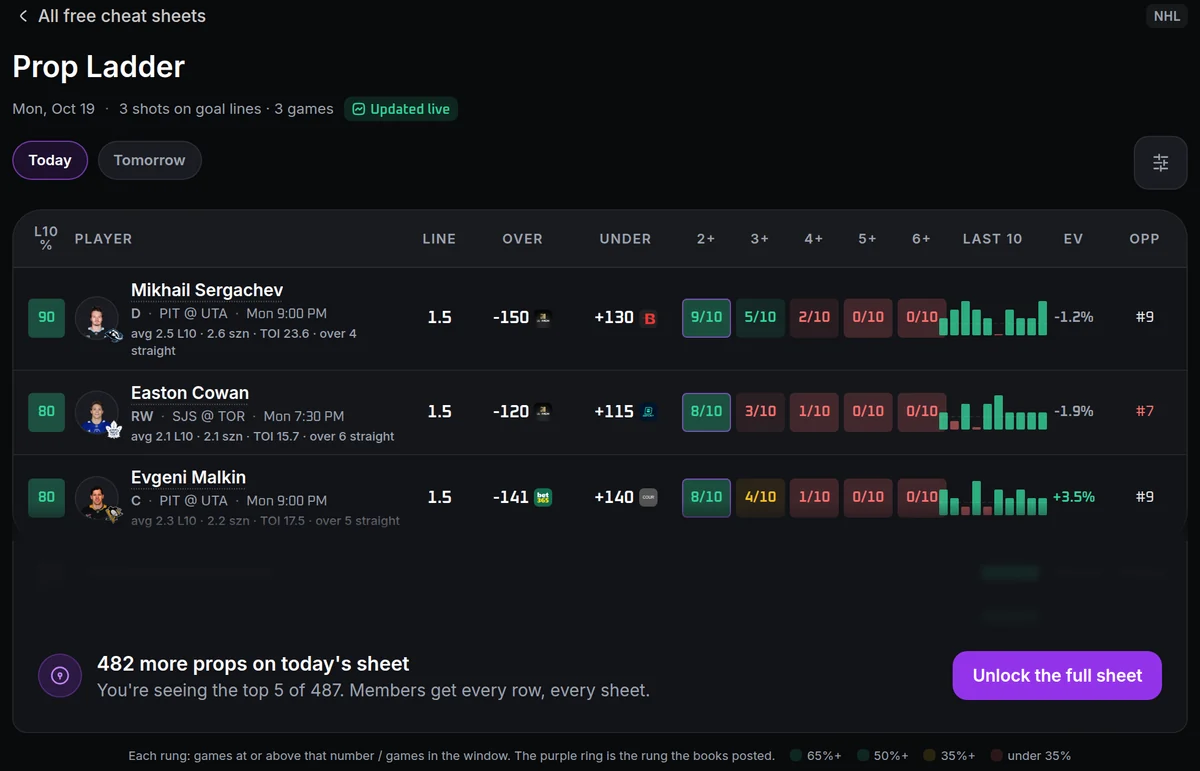
Read Evgeni Malkin's row above. He has put 2 or more shots on net in 8 of his last 10 games, but 3 or more in only 4. At -141, the over 1.5 needs 58.5% to break even; his ladder clears that comfortably at 1.5, and would not at 2.5. The free NHL Prop Ladder shows every rung for the top plays of the night.
Anytime goal scorer is a shots bet with a long price
A goal is a shot that goes in, so the anytime goal market is really two questions: how many shots, and how many of them go in. Shooting percentage is the noisy half. A skater on a hot run scoring on 20% of his shots will cool off, and one stuck at 5% will warm up. Pull every shooting percentage toward the league rate before you trust it, and lean on shot volume, which repeats.
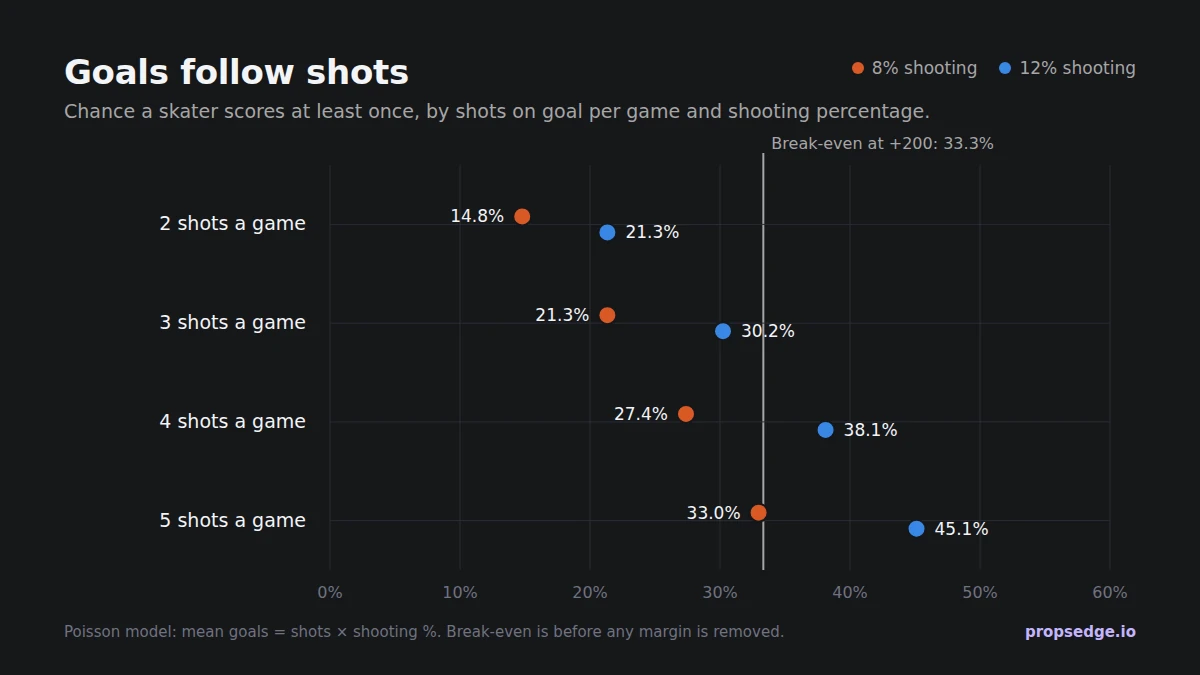
A skater with 3 shots a game at a 12% shooting rate scores in about 30.2% of games, a fair price of roughly +231. Even five shots a game at 8% shooting only reaches 33.0%, short of what +200 needs. Two things follow:
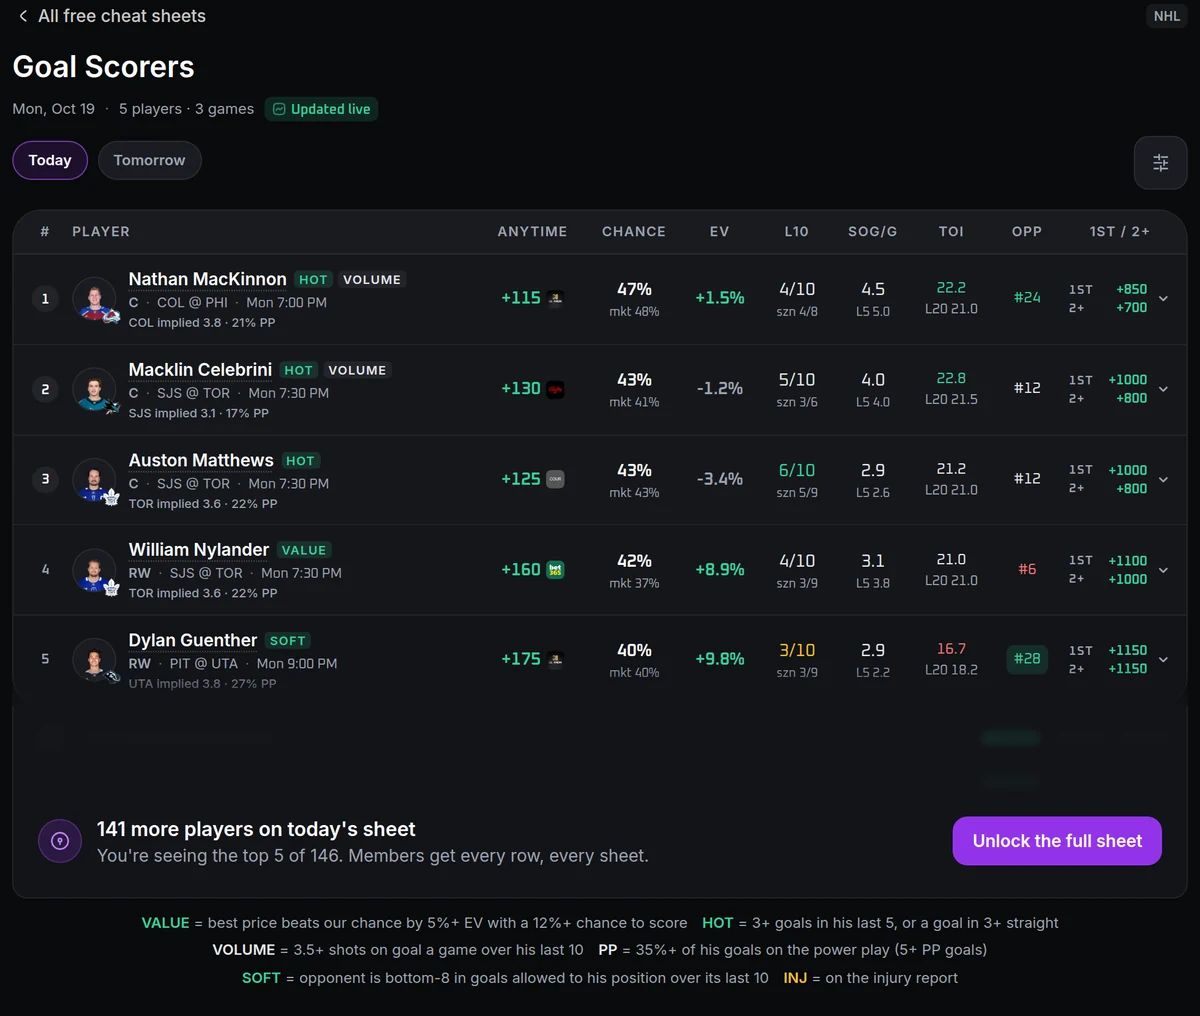
- The best scorers lose most nights. On the free NHL Goal Scorers cheat sheet for October 19, the top name was Nathan MacKinnon at +115 with a 47% chance: even he is more likely to be held off the scoresheet than not. Treat goal scorers as a volume market with small, consistent stakes; the variance guide explains why losing streaks are normal at these prices.
- The margin is big and uneven. Anytime boards carry more margin than two-way props, and it varies by book. The same player can be +180 at one book and +230 at another. The hold calculator shows how much a board is taking.
Most books count overtime goals and leave shootout goals out. Check your book's rules before you bet a game likely to go past regulation.
Points and assists follow the power play
Points (goals plus assists) and assists props reward the players who touch the puck in the offensive zone. The power play is where most of those points come from, so a top-unit role matters even more here than for shots. Two cautions:
- Assists are shared. A goal can carry two assists or none, and secondary assists are close to random. A player's assist rate over 10 games is a weak signal; over 20 or more it starts to mean something.
- Point lines at 0.5 are mostly priced on the team. If the team is projected to score four goals, a top-line center is in on a lot of them. If it is projected for two, even its best player is a coin flip. Start from the team's implied goals, which come straight from the total and the moneyline.
Goalie saves come from the other team
A save is a shot faced minus a goal allowed. That makes a saves projection mostly a projection of the opponent's offense: shots faced × save percentage. A goalie who faces 31 shots at a .905 save percentage makes about 28.1 saves; the same goalie facing 26 shots makes about 23.5. The opponent's shot volume moves the number far more than the goalie's own form.
Three things to check before every saves bet:
- Who is starting. Starters are usually confirmed after the morning skate, and backups often play the second night of a back-to-back. A saves line posted for the wrong goalie is a different bet.
- How many shots the opponent takes, and how many the goalie's own team allows.
- The pull rule. If a goalie is pulled early, many books settle on the saves he made, which sinks an over. Know your book's rule.
The free NHL Goalie Saves cheat sheet builds each starter's projection from exactly these inputs.
Price it, then shop it
Hockey prop markets are thinner than football or basketball, and books react to lineup and goalie news at different speeds. That makes the spread between books wider, and the best price more valuable. Remove the margin from a two-way market with the devig calculator, compare your number to the best price you can take, and use the EV calculator to see what the edge is worth. The free NHL Line Shopping cheat sheet lists props where one book pays well above the consensus. The line shopping guide explains why that habit matters more than any single pick.
On pick'em apps, the price is the slip's payout, not the line. Compare a prop's fair chance with the break-even of the slip you are building; the PrizePicks guide has the table.
The routine
- Check the starting goalies and lineups once they are confirmed.
- Look at minutes first: recent ice time and power-play role for every skater you like.
- Project the count, shots per 60 times minutes, and price the line with a Poisson model.
- For goals, start from shots and pull the shooting percentage toward the league rate.
- Shop every price and only bet the ones that clear break-even with room to spare.
- Stake flat and small, especially on goal scorers. The bankroll guide covers sizing.
Doing it in PropsEdge
The free NHL cheat sheets cover the whole routine. Shots on Goal ranks tonight's shots props from each skater's shots per 60, recent ice time and what the opponent allows to his position, blended with the market's price, with how often he cleared the line. Goal Scorers gives each skater an anytime chance from shot rate, ice time, a shooting percentage pulled toward the league rate and his team's implied goals, blended with the market's price. Goalie Saves, the Prop Ladder and Line Shopping cover the rest, and Defense vs Position and Soft Spots show which teams give up the most to each position. The how to use PropsEdge guide walks through the projections board and player pages. A PropsEdge membership unlocks every row of every sheet and every book's price.
Hockey rewards patience: the right number, at the best price, over a lot of nights. Bet what you can afford to lose. If it stops being fun, stop. Help is free and confidential at 1-800-GAMBLER.
Cover photo: Union College, public domain, via Wikimedia Commons, color graded.