


PropsEdge puts every player prop on one board, prices it against the whole market and shows you how the player has done against that line. This guide walks through the board, the Value toggle, the player page, the pick builder and the cheat sheets, in the order most people use them. It is part of our How to Win series. The other guides in the series cover the math and the apps; this one covers the tool.
If you would rather click through it, the Projections page has a Take a tour button that walks the same ground on screen.
The projections board
Open Projections and pick a league from the pills at the top: NFL, college football, MLB, WNBA, NHL, tennis, soccer and esports (CS2, Valorant, League of Legends and Dota 2), with the NBA and college basketball switching on as their seasons start. Each row is one player, one market and one line, and the columns read left to right:
- The player cell: the line and the market, with badges for anything notable about the player.
- Chance%: the fair probability of the side shown, from the sportsbooks' odds with the margin taken out. It is the market's own answer to "how likely is this?", not a prediction of ours.
- Odds: the best price on the board, with the other books' prices next to it in the order you set under Book Priority.
- L5, L10, L20, H2H and SZN: how often the player has cleared this exact line over his last 5, 10 and 20 games, against tonight's opponent, and this season. Green is 65% or better, yellow 45% to 64%, red under 45%.
- Strk: the active streak, plus for overs and minus for unders.
Every column header sorts. The toolbar above the board narrows it: Books (pick the sportsbooks and apps you actually use), Games, Props, Over/Under, Odds and Ranks, with Settings for the full panel: hit-rate minimums, alt lines, book priority and saved filter profiles. Reset all filters puts it back.
The habit worth building: set Books to the places you can bet once, save it as a profile, and every price on the board is one you can actually take.
The Value toggle
The Chance column has a switch in its header: Chance% or Value. Chance% tells you how likely a side is. Value tells you whether the price you can get is worth taking.
Value is the expected return of the best price against a fair price pooled from at least three real sportsbooks and exchanges. Each book that quotes both sides has its margin removed, the fair prices are averaged, and the book being scored is never part of its own reference, so one generous book can't vouch for itself. Exchange fees are taken out before the comparison. Pick'em apps are never priced or used as a reference, because they don't post odds on each side. By default Value scores the best price anywhere on the board; turn on Only show selected books' odds in the Books filter and it scores only your books.
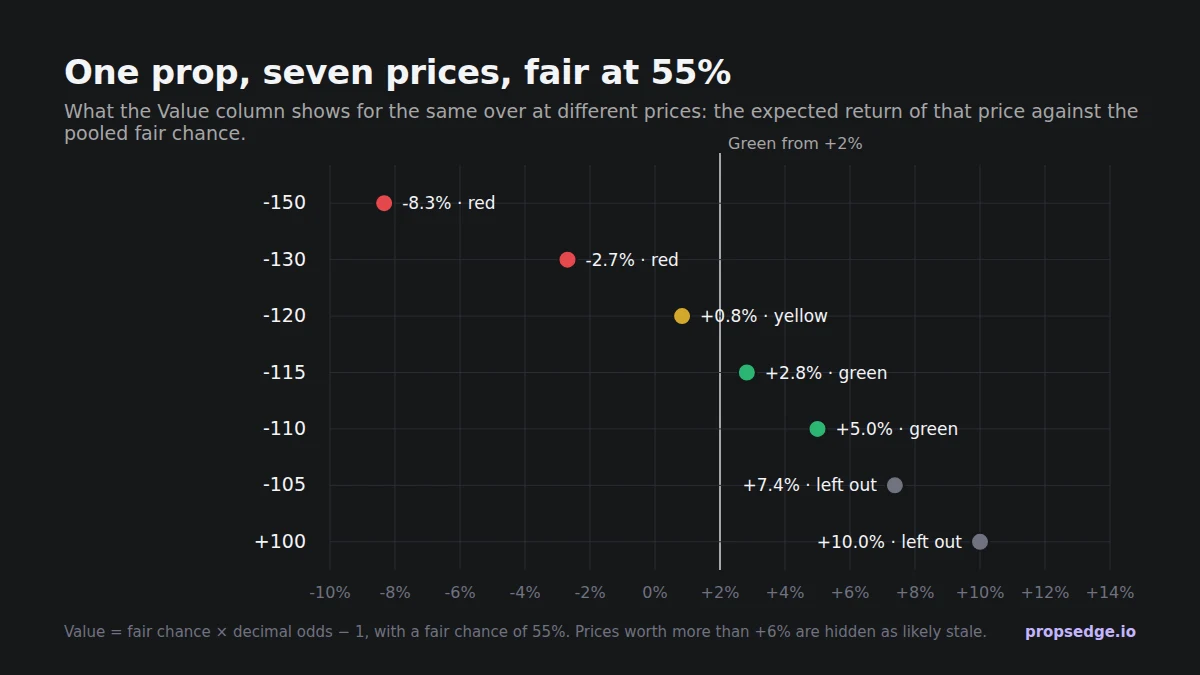
The math is the same as any expected value calculation: fair chance times decimal odds, minus one. A side the market makes 55% fair returns 5 cents per dollar at -110 and loses 8.3 cents at -150. The cell turns green at +2% or better, yellow from 0 to +2%, and red below zero.
Prices worth more than +6% are hidden on purpose. In testing they were almost always stale: a book that hasn't moved after news, or a line that is about to come down. A -105 on the side above would read +7.4%, and if that number were real everyone else would be paying it too.
Switching to Value also sorts the board by it, best first, and rows with no Value (fewer than three books, or a pick'em line) drop to the bottom. That is the fastest way to answer "where is the best price tonight?"
Two notes:
- For pick'em slips, use Chance%. Value has nothing to score on PrizePicks or Underdog, because those apps don't post a price on each side. Compare Chance% with the per-leg break-even of the slip you are building; the PrizePicks guide has the table, and the pick'em payouts guide compares the apps.
- Research+ and Pro add an EV chip on the player cell, so you can see the edge in the row without switching the column.
Research the player
Tap a player and his page opens on the prop you were looking at. The hit-rate bar along the top shows the last 5, 10 and 20 games (and the season, and head to head), with the average and median under it. Below that, the chart shows every game against the line, and filters cut the sample: home or away, wins or losses, regular season or playoffs, and quick filters that keep only games like tonight's.
The right side holds the context: Line Movement (how the number has moved, and at which book), the Win Predictor (win probability from the de-vigged moneyline), game odds and injuries. A 9-for-10 hit rate means less if the line moved two points this morning or the starter next to him is out, and the page puts those facts next to each other.
Build and export the slip
Press + on any row, pick Over or Under, and the prop goes to the pick builder. My Picks groups your picks by league and game, flags demons, goblins and props not available at a book, and shows each book's price. When you are done, Export opens the slip in the app or book you play on, and Share turns it into an image.
Let the cheat sheets do the first pass
The board shows everything. The cheat sheets each answer one question and pull out the handful of props where the answer is yes, every slate:
- Prop Streaks: players clearing, or falling under, today's line game after game.
- Line Shopping: props where one book pays more than the consensus at the same line.
- Line Gaps: pick'em lines sitting well off the books' line: take the over on the low ones and the under on the high ones.
- Defense vs Position and Soft Spots: the defenses giving up the most to a position in a stat, and the props that face them.
- Demons & Goblins: which PrizePicks demons and goblins the books price at the same number.
- Sport-specific sheets: First Basket for the NBA and WNBA, TD Scorers and First TD for football, HR Props and Strikeouts for baseball, Goal Scorers and Shots on Goal for hockey, and more.
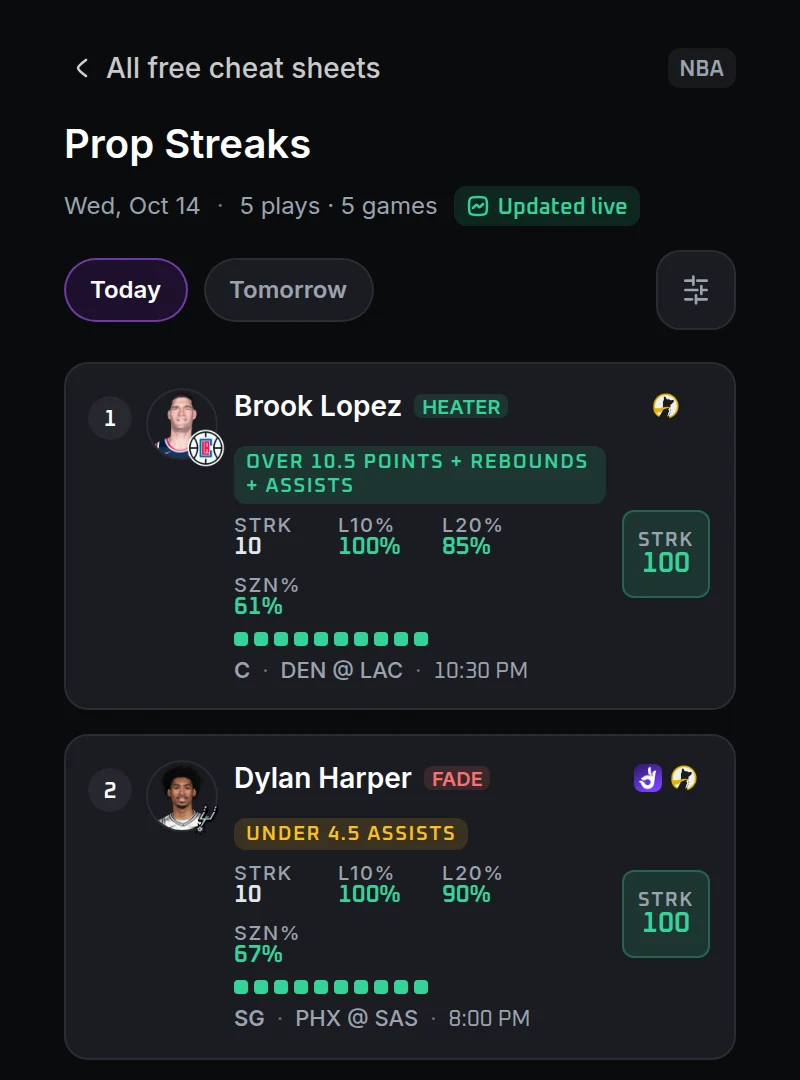
Every sheet has a free preview with the top rows of today's slate. Try the NBA Prop Streaks, NBA Line Shopping, First Basket, HR Props or TD Scorers previews, or browse them all on the cheat sheets page.
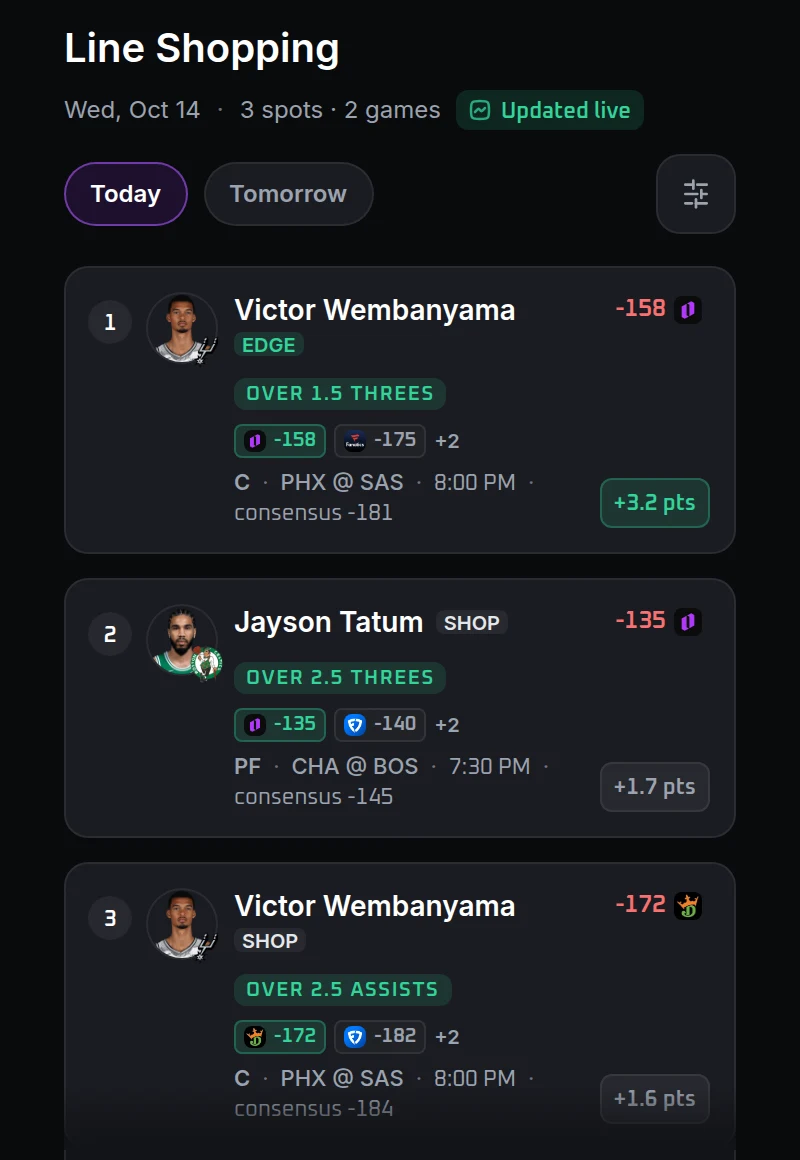
Here is how to read a Line Shopping row. Victor Wembanyama's over 1.5 threes is -158 at one book and -181 across the market. -181 implies 64.4% and -158 implies 61.2%, so the -158 is 3.2 points cheaper for the same bet. The sheet tags anything 1.5 points better as SHOP, 3 points as EDGE and 5 points as STEAL. Line shopping is the most reliable edge there is, because it needs no opinion about the player at all.
Putting it together
- Start with a cheat sheet for the sport you're betting, to get a short list.
- Check each prop on the board: Chance% for pick'em, Value for sportsbooks.
- Open the player page for anything you're about to bet, and check the line movement and injuries.
- Add it with +, then export the slip to where you play.
- Stake flat and keep a log. A +3% edge loses often in the short run; the variance guide and the bankroll guide explain the sizing.
The free cheat sheet previews and our calculators, from the devig calculator to the EV calculator, need no account. The board, the player pages and the full cheat sheets come with a PropsEdge membership: Research covers projections, player pages, line movement and the cheat sheets; Research+ adds the EV indicators and the DFS optimizer; Pro adds the full +EV feed, arbitrage, middles and real-time alerts.
A tool shows you where the price is good. It doesn't make every bet a winner. Bet what you can afford to lose. If it stops being fun, stop. Help is free and confidential at 1-800-GAMBLER.
Cover photo: Alejandro Escamilla, CC0, via Wikimedia Commons, color graded.

.jpg)