
"He's facing the worst defense in the league against small forwards" is one of the most common reasons people give for an NBA prop. Sometimes it is a real edge. Often it is a number built on a handful of games, applied to a player whose role has little to do with the label on his position. This guide covers what defense vs position (DvP) numbers measure, how much they can be trusted, and how much a matchup should actually move your number. It is part of our Sport Guides series; the NBA player props guide covers minutes, usage and the rest of the research.
What defense vs position measures
A defense vs position table shows what each defense allows, per game, to the players listed at each position: points, rebounds, assists, threes and the rest. Sort a stat and you get a ranking from the toughest defense to the softest. The free NBA Defense vs Position cheat sheet shows it over each defense's last 3, 5 and 10 games and the season, with the highest rank as the softest matchup and tonight's opponent alongside.
It answers a narrow question: how much did this defense give up to this position lately? It does not say why. A defense can allow a lot to small forwards because its wings defend badly, because it plays fast and every position piles up numbers, or because two opponents in a row had a star at that spot.
Small samples make soft defenses
The biggest trap is sample size. Points allowed to one position jump around from game to game, so a few games can make an average defense look like the softest in the league.
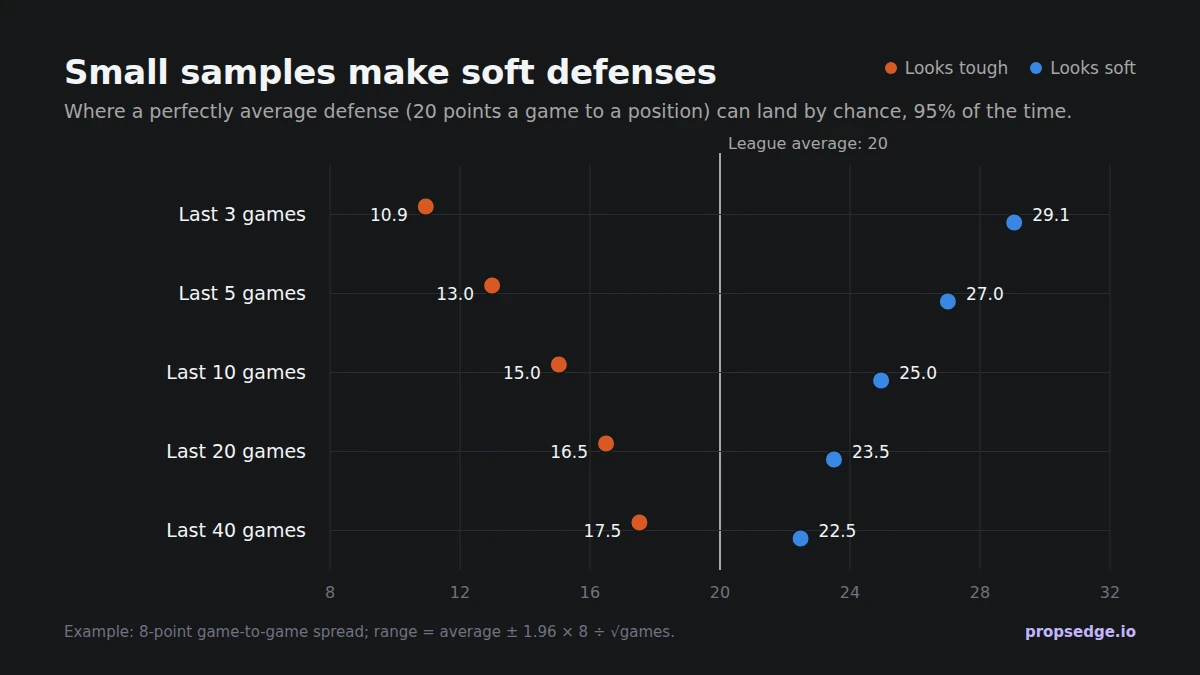
With an example game-to-game spread of 8 points, a defense that is exactly average can show anything from 10.9 to 29.1 points allowed over three games, and still 15.0 to 25.0 over ten. Only around 40 games does the range tighten to 17.5 to 22.5. Early in the season, and in every "last 3" or "last 5" view, a top or bottom ranking is as likely to be noise as a real weakness.
Three ways to protect yourself:
- Prefer longer windows. Use the last 10 games and the season together; when they disagree, trust the season more.
- Look for a reason. A defense that just lost its best wing defender, or one that plays at a fast pace, has a story behind the number. A soft ranking with no reason is usually a short streak.
- Shrink extreme numbers. A defense allowing double the league average over a few games will not keep doing it. Treat it as softer than average, not as a free win.
Positions are labels, not roles
NBA positions are loose. A player listed as a small forward may spend his minutes guarding power forwards; a "point guard" may play off the ball beside a bigger playmaker. DvP groups players by their listed position, so the matchup it describes is a rough one. Before you lean on it, check who your player is likely to be guarded by and what he actually does on offense: a spot-up shooter and a primary ball-handler at the same position face very different nights.
How much a matchup is worth
Even a real soft spot moves a projection by a modest amount, and the line already reflects some of it.
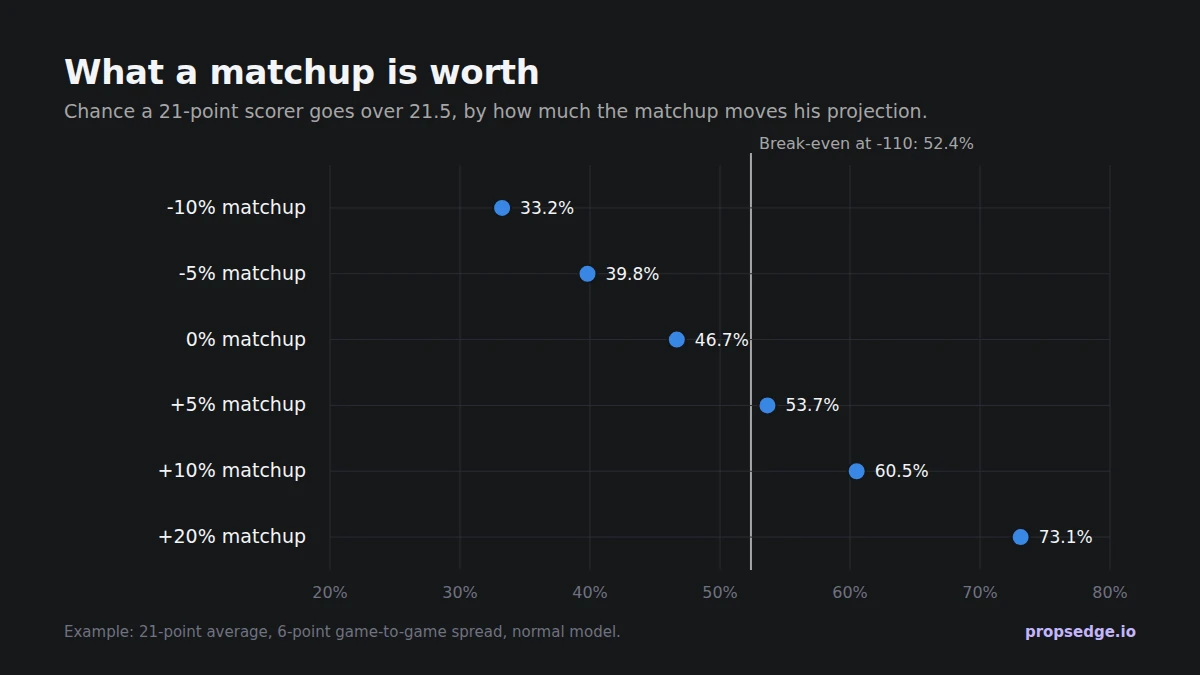
For an example player who averages 21 points with a 6-point game-to-game spread, the over 21.5 is a 46.7% chance before any matchup adjustment. A 5% bump to his projection takes it to 53.7%, just above what -110 needs; a 10% bump takes it to 60.5%. The question is never "is the defense soft?" but "how much does that change his number, and has the line already moved for it?" Sportsbooks see the same tables, so the obvious soft spots are usually priced in. The edge, when there is one, comes from a matchup the line has not caught up with, or a price at one book that has not moved.
Combine the matchup with minutes and price
A matchup multiplies a player's production; it does not create it. Check, in this order:
- Minutes and role. Projected minutes and usage matter more than any matchup. A soft defense does nothing for a player whose minutes are falling.
- Pace. Faster games mean more possessions and more counting stats for everyone.
- The matchup itself, over a long enough window, with a reason behind it.
- His own record at the line. The NBA Prop Streaks cheat sheet shows how often he has cleared it lately.
- The price. Compare the books and take the best number; the NBA Line Shopping cheat sheet flags props where one book pays more than the rest.
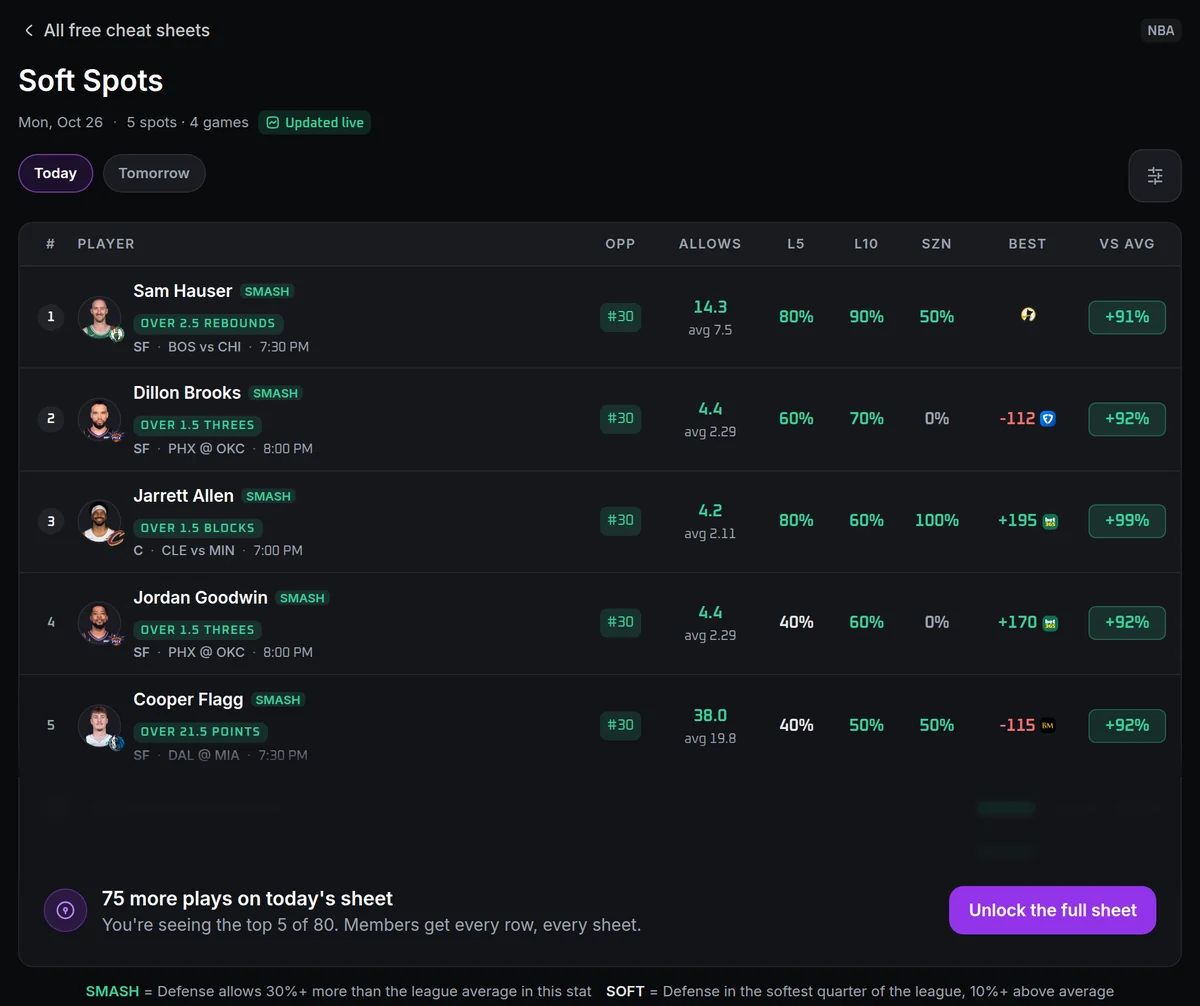
The free NBA Soft Spots cheat sheet does the matching: it lists posted props where the player's position faces one of the softest defenses in that exact stat, in the bottom quarter of the league and at least 10% above the league average, and leaves out long shots, stats too rare to rank fairly and players who have cleared the line in fewer than 4 of their last 10. Read the rows with the rest of this guide in mind. Miami's 38.0 points a game allowed to small forwards is far outside what chance alone usually produces over ten games, so something real may be going on, but no defense keeps allowing nearly double the league average. Shrink it. And Cooper Flagg has cleared 21.5 in half of his last 10; at -115, which needs 53.5% to break even, the matchup alone is not a reason to bet.
The routine
- Start from minutes and role for every player you like.
- Check the matchup over the last 10 games and the season, not just the last few.
- Ask why the defense is soft, and shrink extreme numbers toward average.
- Turn it into a number: how much does the matchup move his projection, and what chance does that give at the line?
- Price it against the best line you can get; the EV calculator shows what the edge is worth.
- Stake flat. The bankroll guide covers sizing, and the variance guide explains why good bets still lose often.
Doing it in PropsEdge
The free NBA sheets cover each step: Defense vs Position for the matchup tables, Soft Spots for the props that line up against the softest defenses, Prop Streaks for each player's record at his line and Line Shopping for the best price. The how to use PropsEdge guide walks through the projections board and player pages, where the matchup sits next to minutes, line movement and injuries. A PropsEdge membership unlocks every defense, every stat, every window and every book's price.
A soft matchup is a reason to look closer, not a reason to bet. Bet what you can afford to lose. If it stops being fun, stop. Help is free and confidential at 1-800-GAMBLER.
Cover photo: Siavash Asadollahnia / Mehr News Agency, CC BY 4.0, via Wikimedia Commons, cropped and color graded.