Free Cheat Sheet — Week 3
Where each defense gives up touchdowns, spot by spot in the pecking order, and who on the other side is lined up to cash in. One game free, the full slate for members.
Free game · Week 3 · CAR @ CLE
 CAR @ CLE
 Sun 5:00 PM
CAR offense into the CLE D
CLE defense, last 10 games
vs WR
×1.20
vs TE
×0.63
vs RB
×1.16
vs QB
×0.63
Leakiest to RB1 (×1.53, #30) · tightest on TE2 (×0.29, #4)
CLE offense into the CAR D
CAR defense, last 10 games
vs WR
×0.95
vs TE
×0.97
vs RB
×1.48
vs QB
×0.98
Leakiest to RB2 (×1.98, #30) · tightest on WR3 (×0.29, #2)
RB · CAR vs CLE · proj 0.91 TD/g
WR · CAR vs CLE · proj 0.69 TD/g
WR · CAR vs CLE · proj 0.67 TD/g

WR · CLE vs CAR · proj 0.66 TD/g
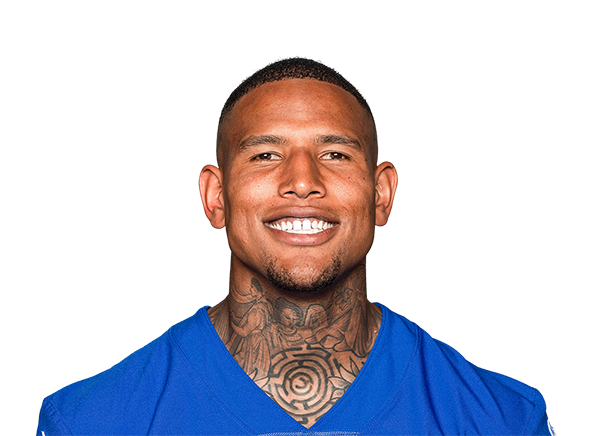
TE · CAR vs CLE · proj 0.53 TD/g

TE · CLE vs CAR · proj 0.47 TD/g
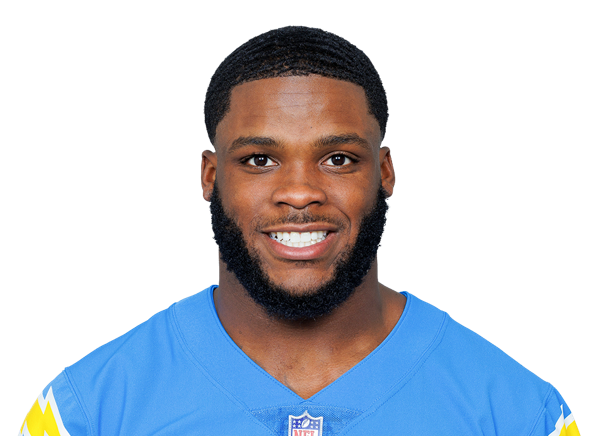
RB · CLE vs CAR · proj 0.39 TD/g

RB · CLE vs CAR · proj 0.37 TD/g
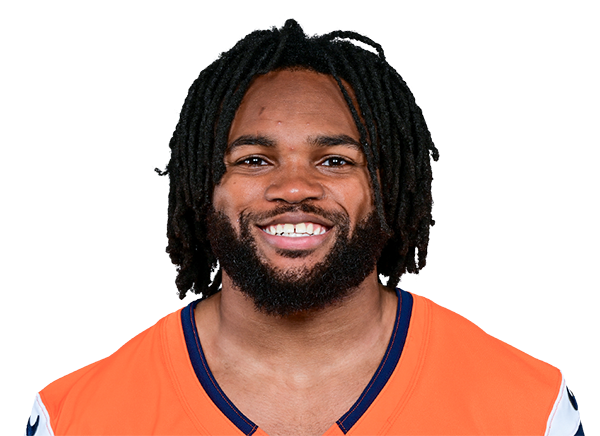
RB · CLE vs CAR · proj 0.20 TD/g
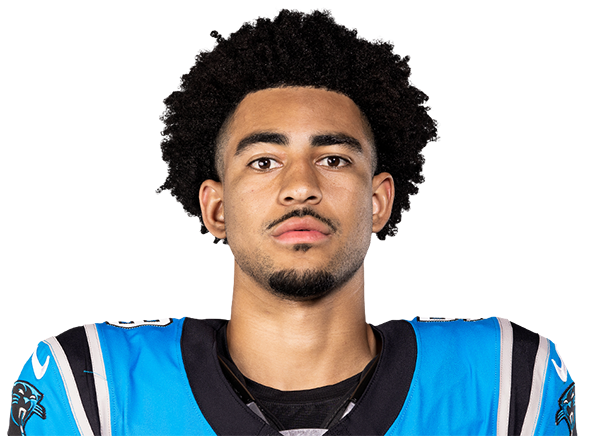
QB · CAR vs CLE · proj 0.18 TD/g

WR · CLE vs CAR · proj 0.17 TD/g
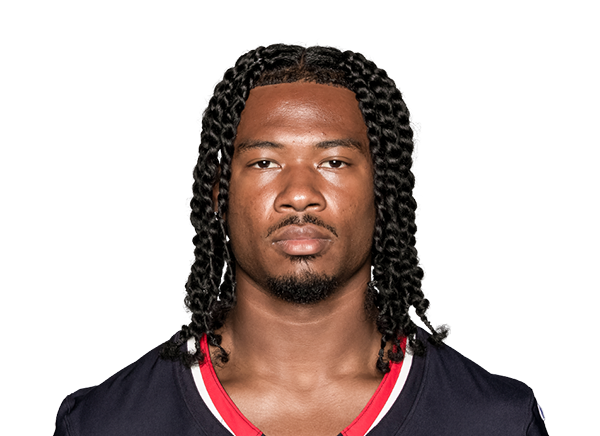
WR · CAR vs CLE · proj 0.16 TD/g

QB · CLE vs CAR · proj 0.14 TD/g
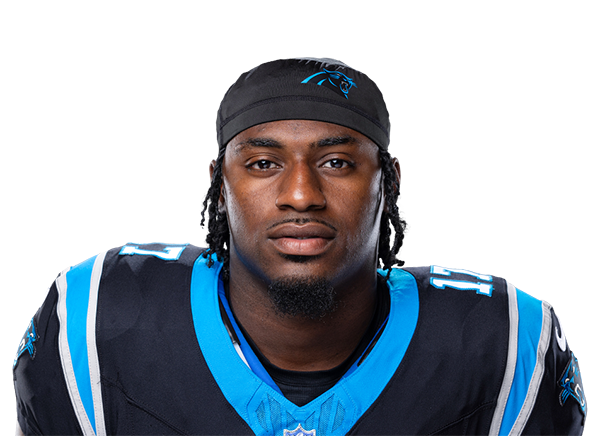
WR · CAR vs CLE · proj 0.13 TD/g

QB · CLE vs CAR · proj 0.12 TD/g

TE · CAR vs CLE · proj 0.06 TD/g

WR · CAR vs CLE · proj 0.06 TD/g
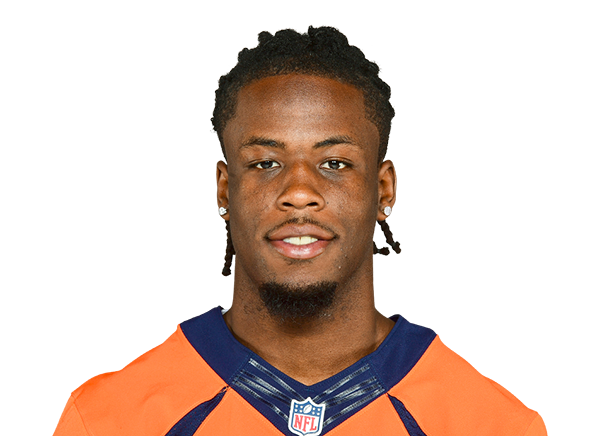
WR · CLE vs CAR · proj 0.03 TD/g
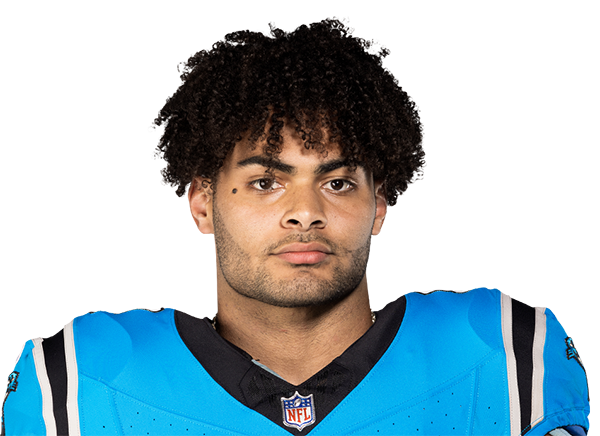
TE · CAR vs CLE · proj 0.03 TD/g

TE · CAR vs CLE · proj 0.01 TD/g
Chuba Hubbard
Jalen Coker
Tetairoa McMillan
Denzel Boston
Darren Waller
Harold Fannin
Raheim Sanders
Quinshon Judkins
Jaleel McLaughlin
Bryce Young
KC Concepcion
John Metchie
Shedeur Sanders
Xavier Legette
Deshaun Watson
Ja'Tavion Sanders
Casey Washington
Jerry Jeudy
Tommy Tremble
Mitchell Evans
14 more games this week
Members open every game with the same detail.
This is a preview — members see the full TD Scorers Cheat Sheet.
Every game, every player, full stat breakdowns, live odds comparison across 15+ sportsbooks, and 8 more daily cheat sheets.
Unlock the Full SheetTouchdowns don’t leak evenly. One defense bleeds them to the lead back, another to the slot receiver behind the star. This sheet draws each offense as a formation against the other team’s defense and sizes every spot by how many TDs that defense has allowed to it, against the league rate.
Below the maps, every skill player in the game gets a TD chance built from his own scoring rate and that leak, the fair price it implies, his edge against the best anytime TD odds, his volume and his red-zone looks.
That defense has allowed 1.53 times the league-average rushing + receiving touchdowns per game to that spot in the pecking order over the selected range. ×1.00 is average; above it (teal) the defense leaks to that role, below it (red) it shuts it down.
By usage, not the depth chart: receivers and tight ends by targets, backs by carries plus targets, over each player’s recent games. Players ruled out are skipped, so the next man up moves into the role.
His own rushing + receiving TDs per game, blended toward a typical player in his role when the sample is small, multiplied by the defense’s leak to that role. That rate becomes the chance of at least one TD, and Edge compares it with the best anytime price’s implied chance.
The free page shows the next game on the slate in full. Members see every game, every week, with the same detail.
