
A running back's rushing yards line is really two forecasts multiplied together: how many times he will carry the ball, and how far each carry goes. The second one gets most of the attention, because it is where the highlight runs live. The first one decides more bets. Carries swing a lot from week to week, and most of that swing is predictable from the backfield depth chart and the betting market itself. This guide is part of our Sport Guides series. The NFL player props guide covers the general method, and the passing yards guide works through the same idea for quarterbacks.
Start with carries
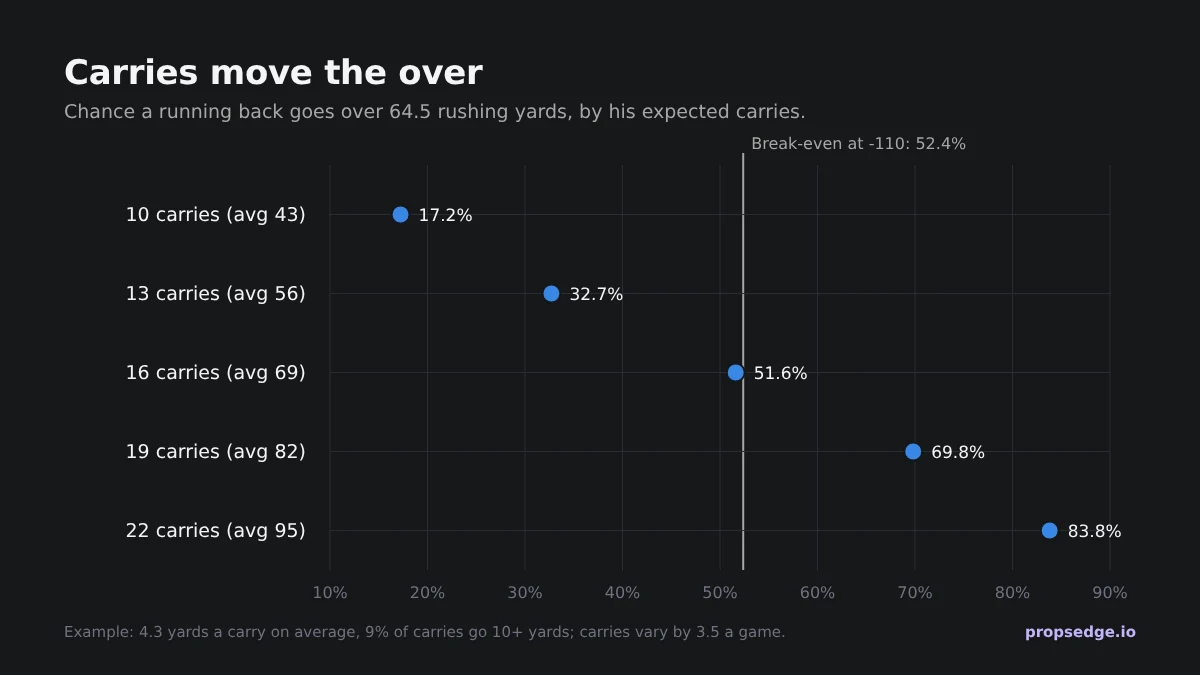
At the same 4.3 yards a carry, a back expected to get 10 carries clears 64.5 yards about 17% of the time, and one expected to get 22 about 84% of the time. No matchup moves the number that much. Three things set his carries:
- His share of the backfield. Few teams give one back every carry any more. Look at his share of the team's running back carries over the last few games, not the season, because roles change. A back who has gone from a 50/50 split to 70% of the work is a different bet even if his season averages haven't caught up.
- Game script. Teams that lead run the ball to burn clock; teams that trail throw to catch up. The spread tells you who is expected to be ahead. A big favorite's lead back often gets his most carries in the fourth quarter, and a big underdog's back can lose carries to the passing game, or to a third-down back, once his team falls behind.
- Injuries around him. When the starter is out, the backup inherits most of his carries, and his line usually rises more slowly than his role. Check the injury report all the way to Sunday.
The total matters too. A high total means more plays for both offenses. The team totals implied by the spread and total are the quickest check: favorite = (total + spread) ÷ 2, underdog = (total − spread) ÷ 2. A favorite with a high team total is the classic spot for a lot of carries.
Then yards per carry
Once you have carries, adjust how far each one goes.
- The run defense. Use rushing yards allowed to running backs over a fair window, and remember who those backs were. A defense that just faced three of the league's best rushers will look worse than it is.
- His offensive line. An injured starter on the line costs more than most matchups, especially at center or tackle.
- Box counts and the quarterback. A quarterback who can hurt a defense through the air pulls defenders out of the box and opens running room. A team with a backup quarterback often sees more defenders near the line.
- Weather. Heavy rain and snow tend to mean more runs, so they can help carries more than they hurt yards per carry.
Why the median beats the average
Rushing yards are lopsided. Most carries gain a few yards, but a small share break for 10, 20 or 60, and those long runs pull a back's average above his typical game.
In the model behind these charts, a back with 16 expected carries averages 69 rushing yards a game, but his median is 66: half his games land at 66 or fewer. A line set at his average, 68.5, goes over only about 46% of the time. That is why an over priced off a back's season average is often worse than it looks. One 70-yard run in his last five games can lift his average by 10 yards without changing what he usually does. Check his game log for one big run before you trust a high average, and lean on the median when you compare his recent games with the line. The receiving yards guide shows the same effect for catches.
The other side of the skew: the same back clears 100 yards about 14% of the time, so long alternate overs aren't hopeless, they just need the right price.
How the stat is counted
- Kneel-downs count. A quarterback's kneel is a rushing attempt for a loss, usually a yard or two. A quarterback who closes out a win with three kneels can lose several yards off his rushing total, which matters for quarterback rushing props with low lines.
- Sacks don't, in the NFL. An NFL sack comes off the team's passing yards, not the quarterback's rushing yards. A scramble that crosses the line of scrimmage is a run and counts. College football counts sacks as rushes, so check which rule applies before betting a college quarterback's rushing line.
- Leaving early. If a back is hurt or benched for fumbling, the over usually loses. Books have their own rules for players who start but don't finish, so check yours.
Price every alternate line from one projection
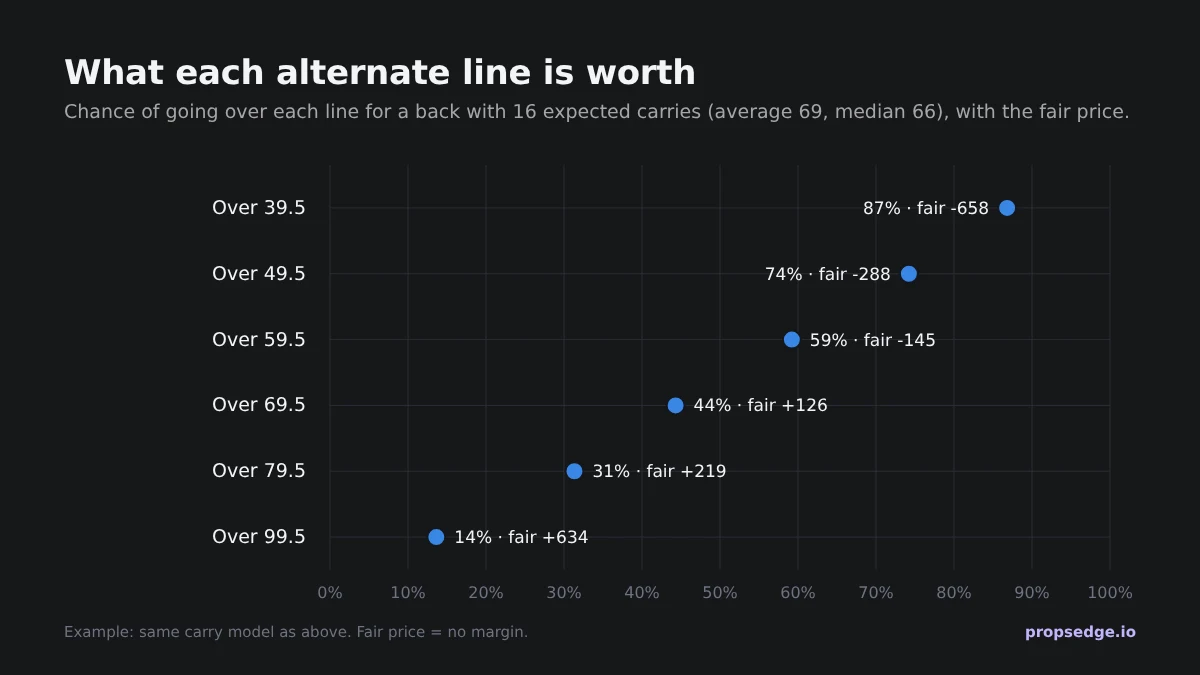
For the same back, over 49.5 should hit about 74% of the time, a fair price of -288, and over 99.5 about 14%, a fair price of +634. Compare the book's price at each rung with the fair one. Alternate lines carry their own margins, so an over 99.5 at +750 is an edge on this projection, while an over at his median line of 65.5 at -110 is a pass. The odds converter turns any price into its implied chance, and the EV calculator shows what the gap is worth.
- Shop. Books often post different rushing lines for the same back. The free NFL Line Shopping cheat sheet flags props where one book is paying meaningfully more than the rest.
- Watch the move. Rushing lines move hard on injury news, in both backfields. The free NFL Steam Moves cheat sheet tracks the biggest moves from open to now.
- Devig the two sides when a book posts both, with the devig calculator, before you compare its price with your projection.
On pick'em apps there is no price on each pick, only the payout of the whole slip. A pick on a two-pick PrizePicks Power play needs to hit about 57.7% of the time to break even, more than a -110 bet's 52.4%. Because rushing yards are skewed, the under on a line set near a back's average is the more common spot there.
The matchup, on the sheet
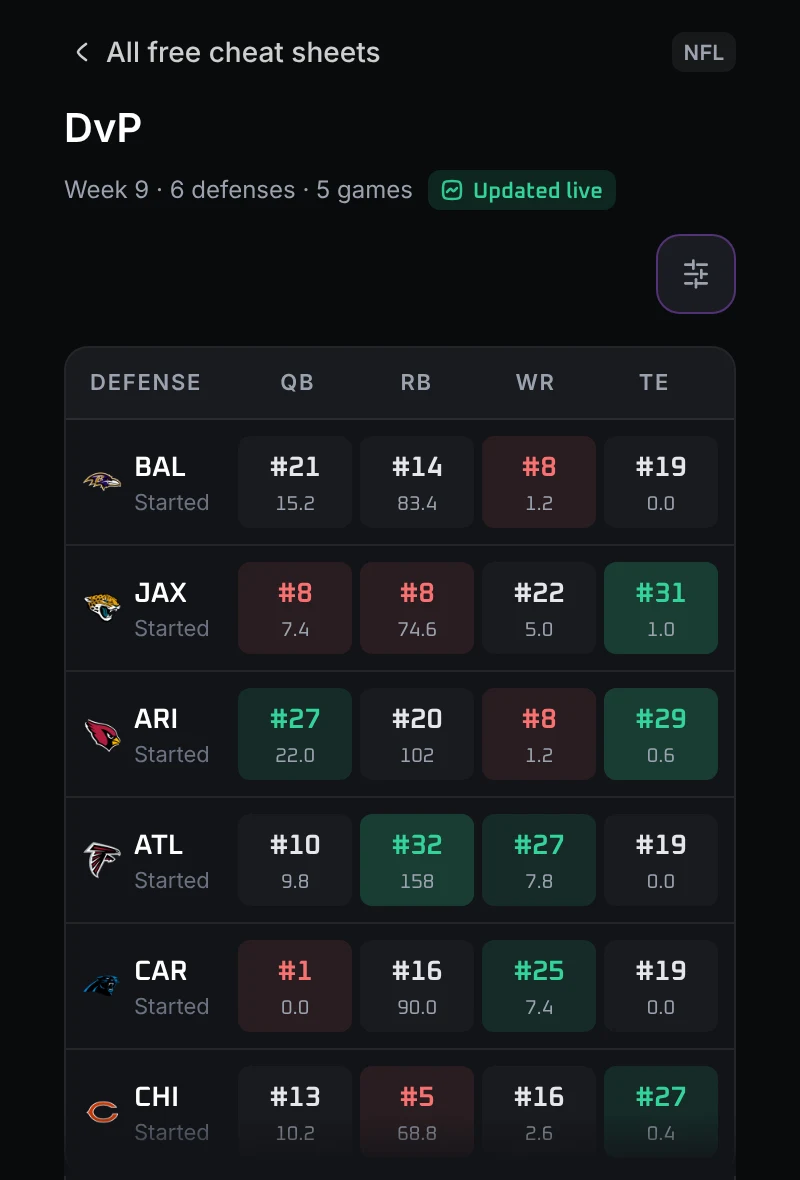
The free NFL Defense vs Position sheet shows what each defense has allowed to each position, by stat and window. This week, over the last 5 games, Atlanta has allowed 158 rushing yards a game to running backs, the most in the league, more than twice Chicago's 68.8. That is a reason to nudge yards per carry up for whoever runs against Atlanta, not a reason to bet the over on its own. Five games is a small sample: shrink the gap toward average, check which backs Atlanta faced, and remember that a defense whose own offense struggles faces more carries, because the team in front runs to protect the lead. The defense vs position guide explains how far to trust numbers like these; the method is the same in every sport.
The free NFL Soft Spots cheat sheet lines posted props up against the softest defenses for that position and stat, and Prop Streaks shows how often each player has cleared his current line lately. Both are shortlists, not bets. For touchdowns rather than yards, the anytime touchdown guide covers red-zone roles.
The routine
- Carries first, from his share of the backfield, the spread, the total and the injury report.
- Yards per carry, adjusted for the run defense over a fair window, his line and the quarterback.
- Projection to probability, using the median as well as the average, at the main line and every alternate line.
- Price, shopped across books, devigged where both sides are posted, and checked against line moves.
- Stake flat. Even with a good projection, one long run or one fumble can decide the bet. The bankroll guide covers sizing, and the variance guide explains why good bets still lose often.
Doing it in PropsEdge
The projections board shows every back's rushing line with our projection, the line movement and the best price across sportsbooks, and the free NFL cheat sheets above cover the matchup, the streaks and the price. A PropsEdge membership unlocks every row of every sheet.
A rushing yards line is a forecast of a whole game, not just a running back. Bet what you can afford to lose. If it stops being fun, stop. Help is free and confidential at 1-800-GAMBLER.
Cover photo: Antonio Gibson at Washington training camp. All-Pro Reels, CC BY-SA 2.0, via Wikimedia Commons, cropped and color graded.